subconscious.ai
Fidelity Report
2026

Anyone can loop a language model. An experiment is a different machine.

Do not trust a simulated customer until it predicts the effect of a real decision. Subconscious runs calibrated experiments on synthetic customers and grades them the hard way: did the simulation predict what real people did when the price changed, misses included.

Source: Grounding the Map of Causality (PDF) — a Subconscious working paper, not peer reviewed; paper, figures, and source hosted on this page.

The for-loop test

Ask a chatbot the same question a thousand times and you get a thousand fluent answers.

Nothing in that loop measures what happens when the price changes, and nothing in it warns you when the answer is wrong. Every layer of the pipeline exists because the naive version fails in a documented way. A loop always returns an answer. An instrument refuses to.

A for-loop around a language model

  • Personas are flavor text in a prompt.
  • The "treatment" is a phrasing change, so hidden context shifts with it.
  • Results are counted answers: no design, no parameters, no intervals.
  • It cannot tell you when it is wrong.

The Subconscious pipeline

  • Factorial experimental design: effects come from designed contrasts, not prompt phrasing.
  • Synthetic samples matched to census statistics (the American Community Survey and National Household Travel Survey), not invented personas.
  • Discrete-choice estimation: parameters with confidence intervals, not vote counts.
  • Order-invariance filters: if the answers change when the options are shuffled, the design is rejected before results are reported.
  • Grounded on ~300 replicated human studies; the rank-correlation grades and the misses are on the fidelity ladder below.

Every pipeline claim traces to the hosted paper (PDF) and its cited failure modes: prompt confounding, demographic flattening, social-desirability bias, prompt sensitivity.

Evidence funnel

Most of the field stops before intervention.

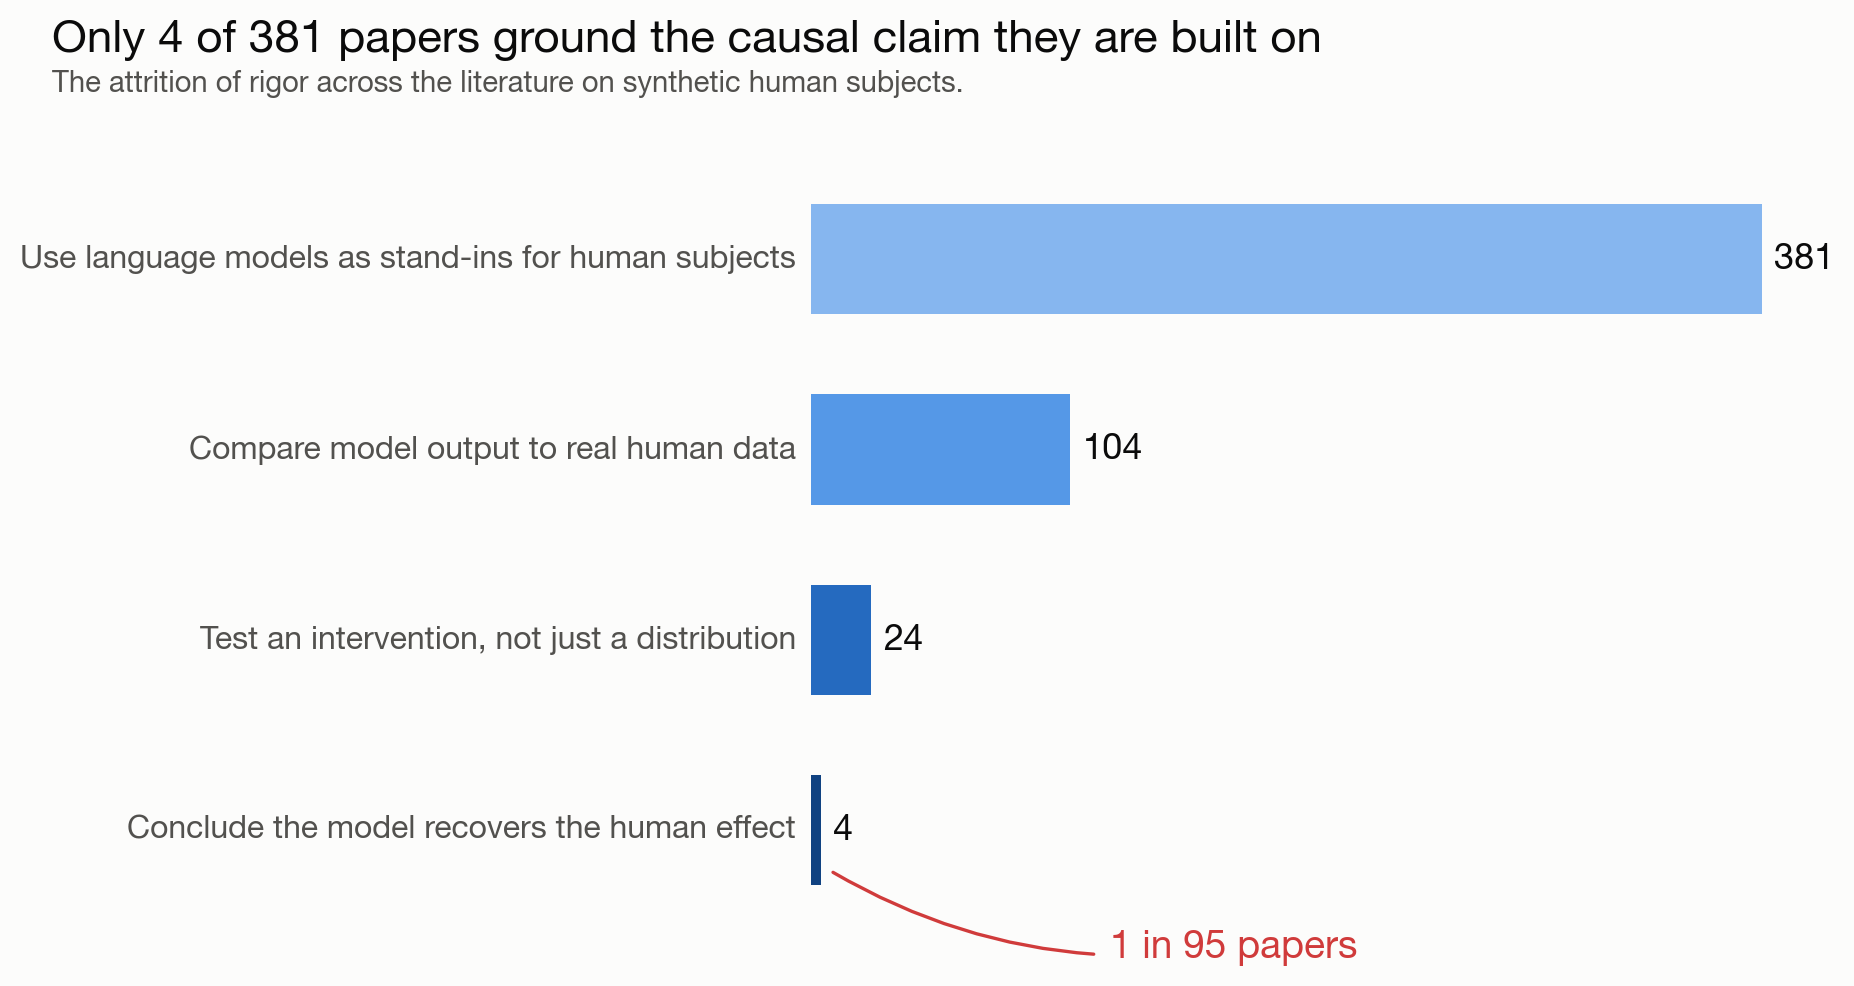
An intervention is a deliberate change: a new price, a different message. One paper in 95 grounds the causal claim it is built on. Our review covers the field's arXiv corpus, each paper coded from its title and abstract against a fixed rubric by a language model, with verdicts self-reported by each paper.

Scope: the corpus is arXiv-only, so off-arXiv work sits outside this funnel, including the strongest result in the field, Hewitt, Ashokkumar, Ghezae and Willer (Nature, in press), which is credited on the ladder below.

Explore the corpus - all 381 papers

Source figure: rigor funnel

The original paper figure behind the 381 to 104 to 24 to 4 claim. This is the evidence path the page should force diligence readers to confront.

Original paper figure showing 381 papers narrowing to 104 human comparisons, 24 interventions, and 4 successful interventional validations.
Original figure from the causal-fidelity paper (PDF).

Definition

Causal Fidelity is the standard for whether a synthetic population reproduces human treatment effects on experiments it has not seen.

In plain terms: change the price in the simulation and in the real world; a faithful simulation moves the same way, by about the same amount, and says how sure it is. The technical measurement is interventional fidelity: agreement between synthetic and human treatment effects, reported with confidence intervals.

Fidelity ladder

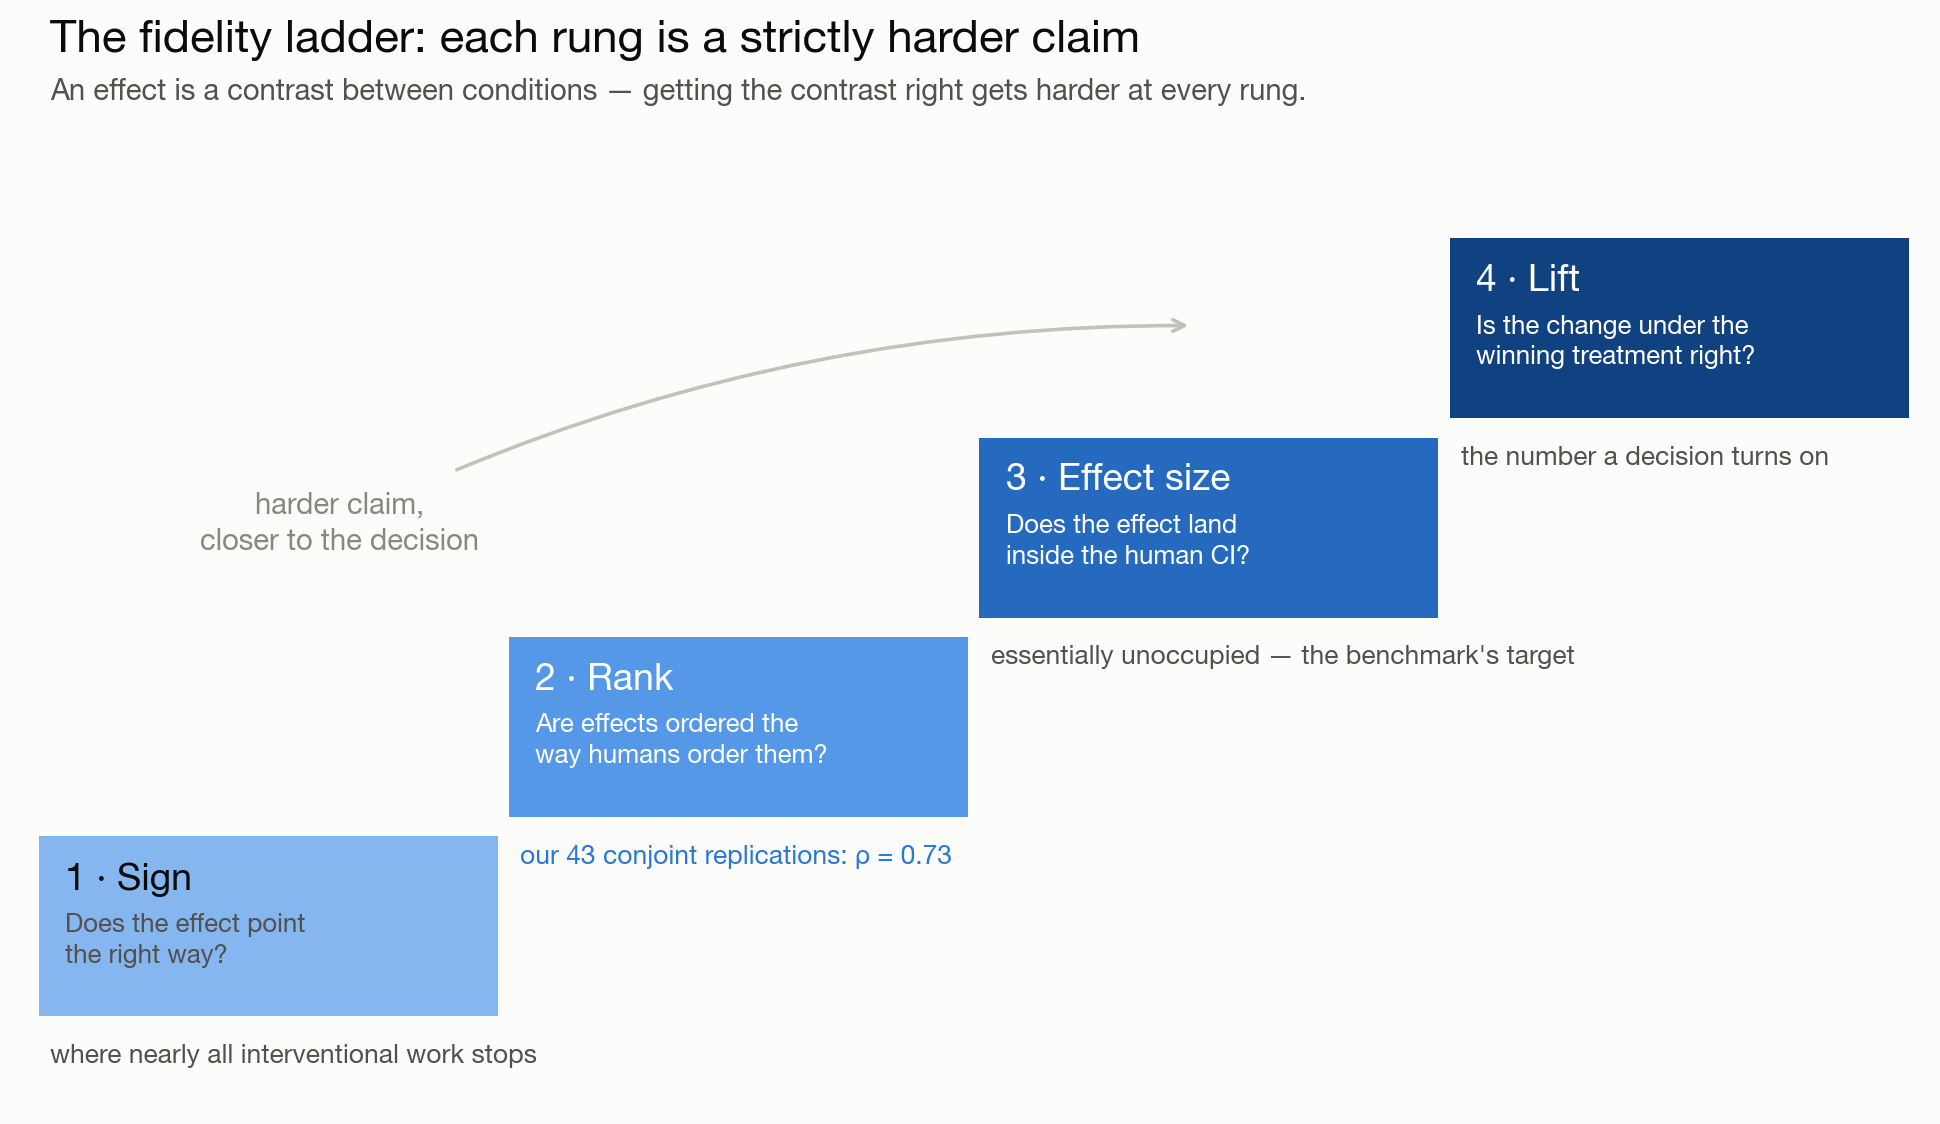
Rigor climbs from direction to decision lift.

  1. 1

    Sign

    Did the synthetic effect point the right way?

    Most work stops here.
  2. 2

    Rank

    Did it order effects the way people did?

    Subconscious: 0.55 rank correlation across all ~300 replications, 0.73 on the 43 passing design filters.
  3. 3

    Effect size

    Did the synthetic estimate land inside the human interval?

    This is the credibility line for decisions.
  4. 4

    Decision lift

    Did it predict the change the business depends on?

    This is the flight-simulator claim.
How the rank numbers were computed

Roughly 300 conjoint replications were run against published human studies; order-invariance design filters pass 43 of them. Rank correlation between synthetic and human effect orderings is 0.55 across all replications and 0.73 on the filtered set. Working-paper claim; the per-study table is not yet public (release in preparation).

The rank-rung numbers above are working-paper claims (the working paper, PDF). Strongest prior work on the effect-size rung: Hewitt, Ashokkumar, Ghezae and Willer (Nature, in press) predict pooled treatment effects at r = 0.85 across attitude experiments. The gap is narrowing: Persson, Schultzberg and Ankargren (Spotify, 2026) validate LLM treatment effects experiment by experiment on content-choice A/B tests — raw models recover roughly 39% of the human effect before calibration — and Brand, Israeli and Ngwe (2026) find GPT conjoint willingness-to-pay estimates often inaccurate or wrong-signed. The still-open wedge: calibrated per-experiment CI overlap on conjoint pricing and choice decisions, run blind before the human result exists.

Source figure: fidelity ladder

The paper's ladder makes the separation explicit: matching direction is not enough; decisions need effect sizes and interventional lift.

Original paper fidelity ladder from sign to rank to effect size to interventional lift.
Original figure from the causal-fidelity paper (PDF).

Calibration example

A single score hides the useful part.

The misses show where the model should not be trusted yet. A useful validation output shows recovery and failure modes at the same time.

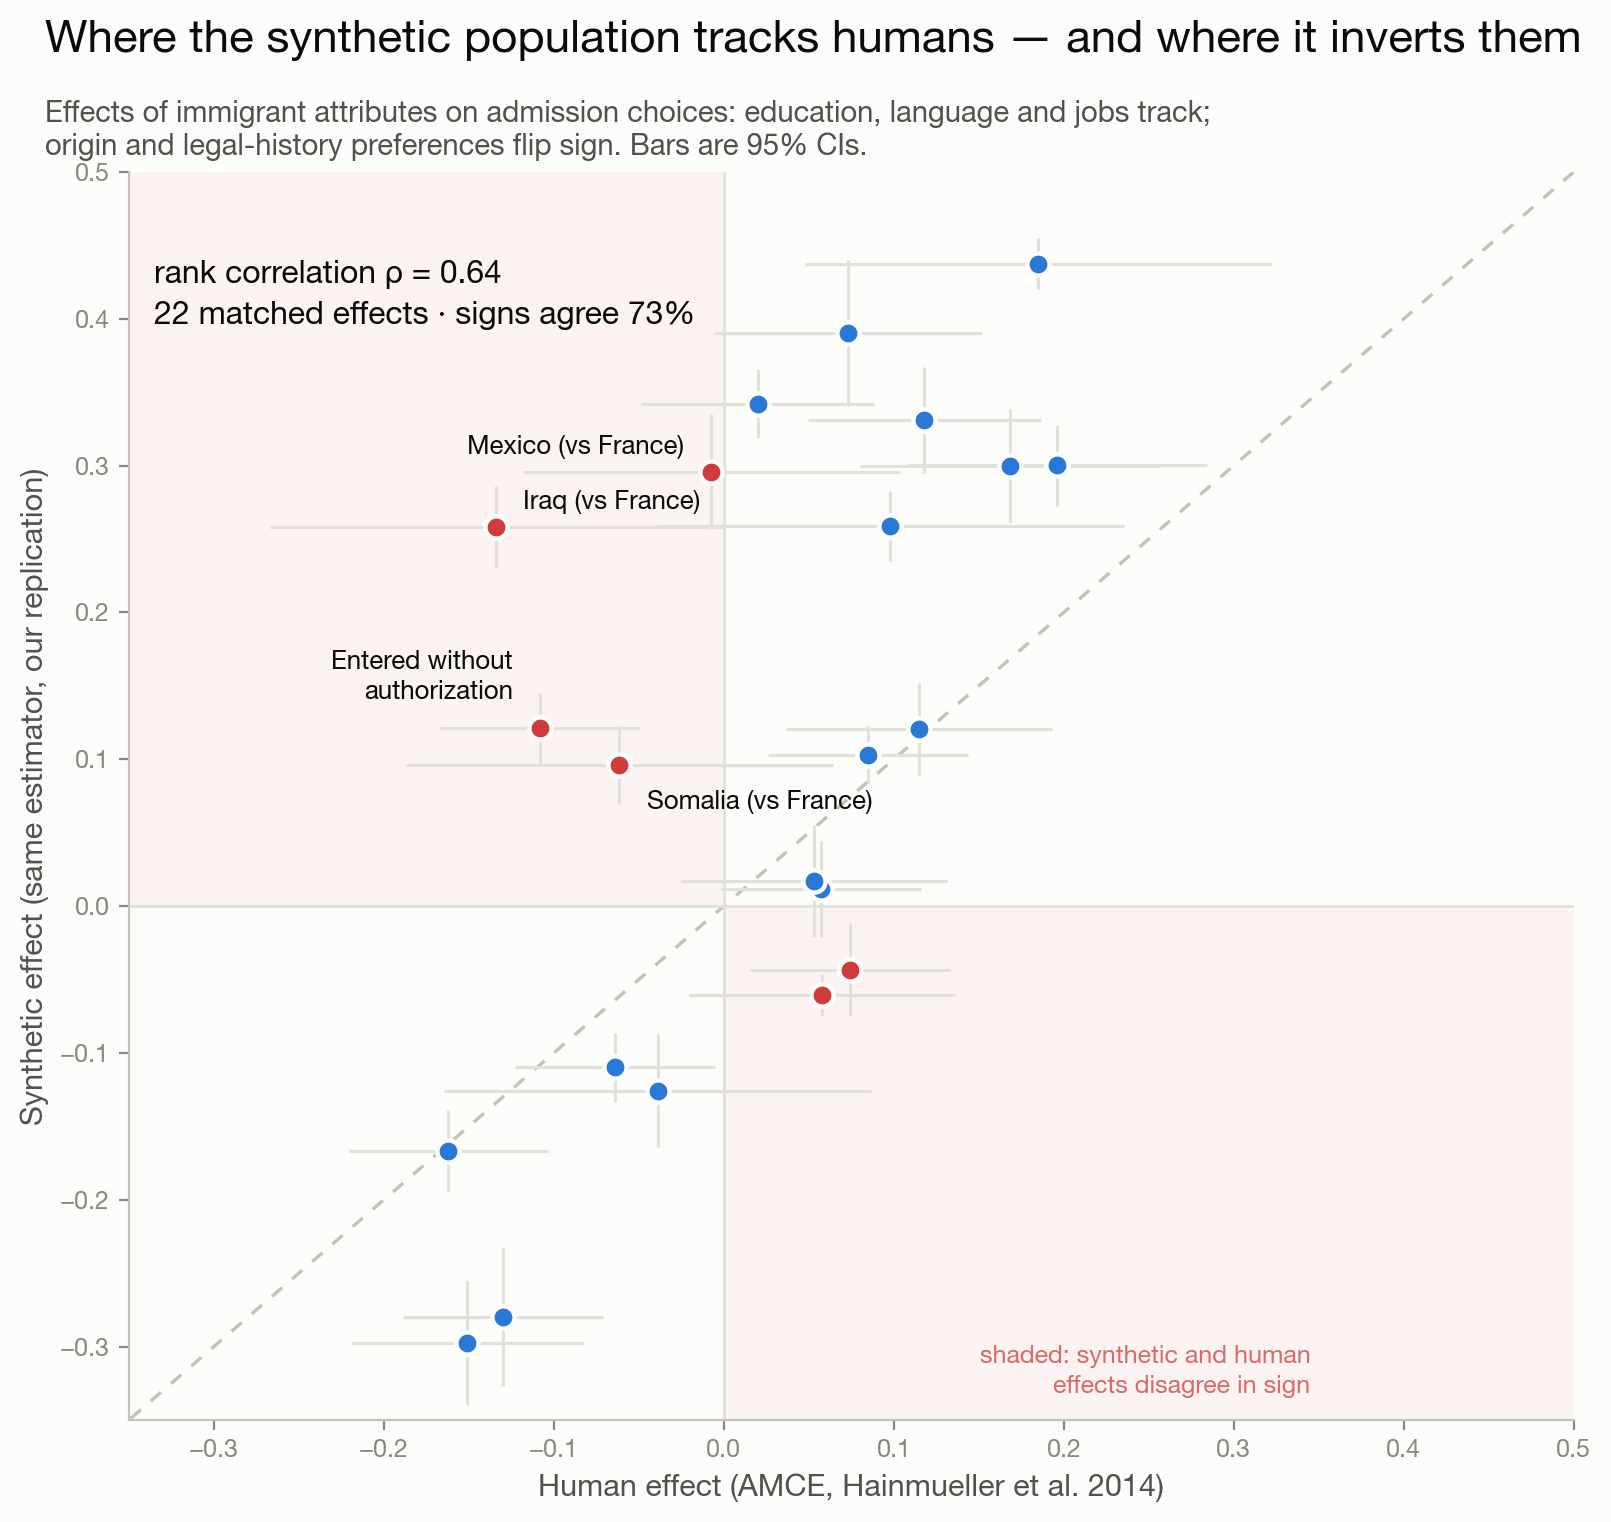
Paper claim: the immigrant conjoint replication reached 0.64 rank correlation and 73% sign agreement. Sign flips concentrate in origin and legal-history effects.

Synthetic effects plotted against human effects A simplified calibration plot showing most estimates near the perfect recovery diagonal and red misses off the diagonal. perfect recovery sign flip trust boundary human effect synthetic effect

Illustrative sketch, drawn to show how to read a calibration plot; not real data. The actual replication plot is below.

Source figure: calibration plot

The original plot keeps the uncomfortable part visible: confidence intervals, sign flips, and where the synthetic population does not yet deserve trust.

Original calibration plot comparing synthetic and human average marginal component effects with confidence intervals.
Original plot from the causal-fidelity paper (PDF). Red marks sign flips; intervals show uncertainty.
How this was measured

The replication compares synthetic and human average marginal component effects (AMCEs) from the immigrant conjoint, each with confidence intervals. Headline grades: 0.64 rank correlation, 73% sign agreement. Full specification is in the working paper (PDF); the per-study replication data is not yet public (release in preparation).

Where the method fails

The misses are the spec.

Every vendor in this category reports its wins. Here are the three places our own record says the method cannot yet be trusted, stated before anyone asks.

  1. working-paper claim

    27% of the immigrant-conjoint effects pointed the wrong way.

    The replication reached 0.64 rank correlation and 73% sign agreement, which means roughly one effect in four flipped sign. The flips are not random: they concentrate in origin and legal-history effects, exactly where a language model's training prior is strongest.

    Source: Calibration plot (PNG)
  2. working-paper claim

    Most replications fail our own design filters.

    Across all ~300 conjoint replications the rank correlation is 0.55. Only 43 pass the order-invariance filters, and the 0.73 figure applies to those alone. Unfiltered, the pipeline is not decision-grade, and the filters reject most designs.

    Source: Working paper (PDF)
  3. not yet demonstrated

    The effect-size rung is still empty.

    No Subconscious result has yet shown synthetic estimates landing inside human confidence intervals experiment by experiment. That rung is the credibility line for decisions, and today it is a claim about the roadmap, not the record.

    Source: Fidelity ladder, rung 3

Validation workflow

Validation is the product.

The workflow turns a paper standard into an operating process: frame the decision, compare effects, declare the trust boundary.

  1. 1

    Frame the decision

    Price, message, product, policy, segment, and outcome.

  2. 2

    Find the human baseline

    Published experiment, held-out study, or customer-confirmed baseline.

  3. 3

    Run the synthetic experiment

    Same intervention structure, synthetic population, controlled variation.

  4. 4

    Compare treatment effects

    Direction, rank, effect size, and interval overlap.

  5. 5

    Declare trust boundary

    Where the model can support the decision, where it failed, and what needs human confirmation.

Proof inventory

Every public number carries status.

ClaimStatusSource rule
381 papers public data The corpus itself: every paper with title, authors, and arXiv ID (CSV).
104 human comparisons working-paper claim Rigor-funnel figure restates the paper's coding; the per-study evidence table is not yet public (release in preparation).
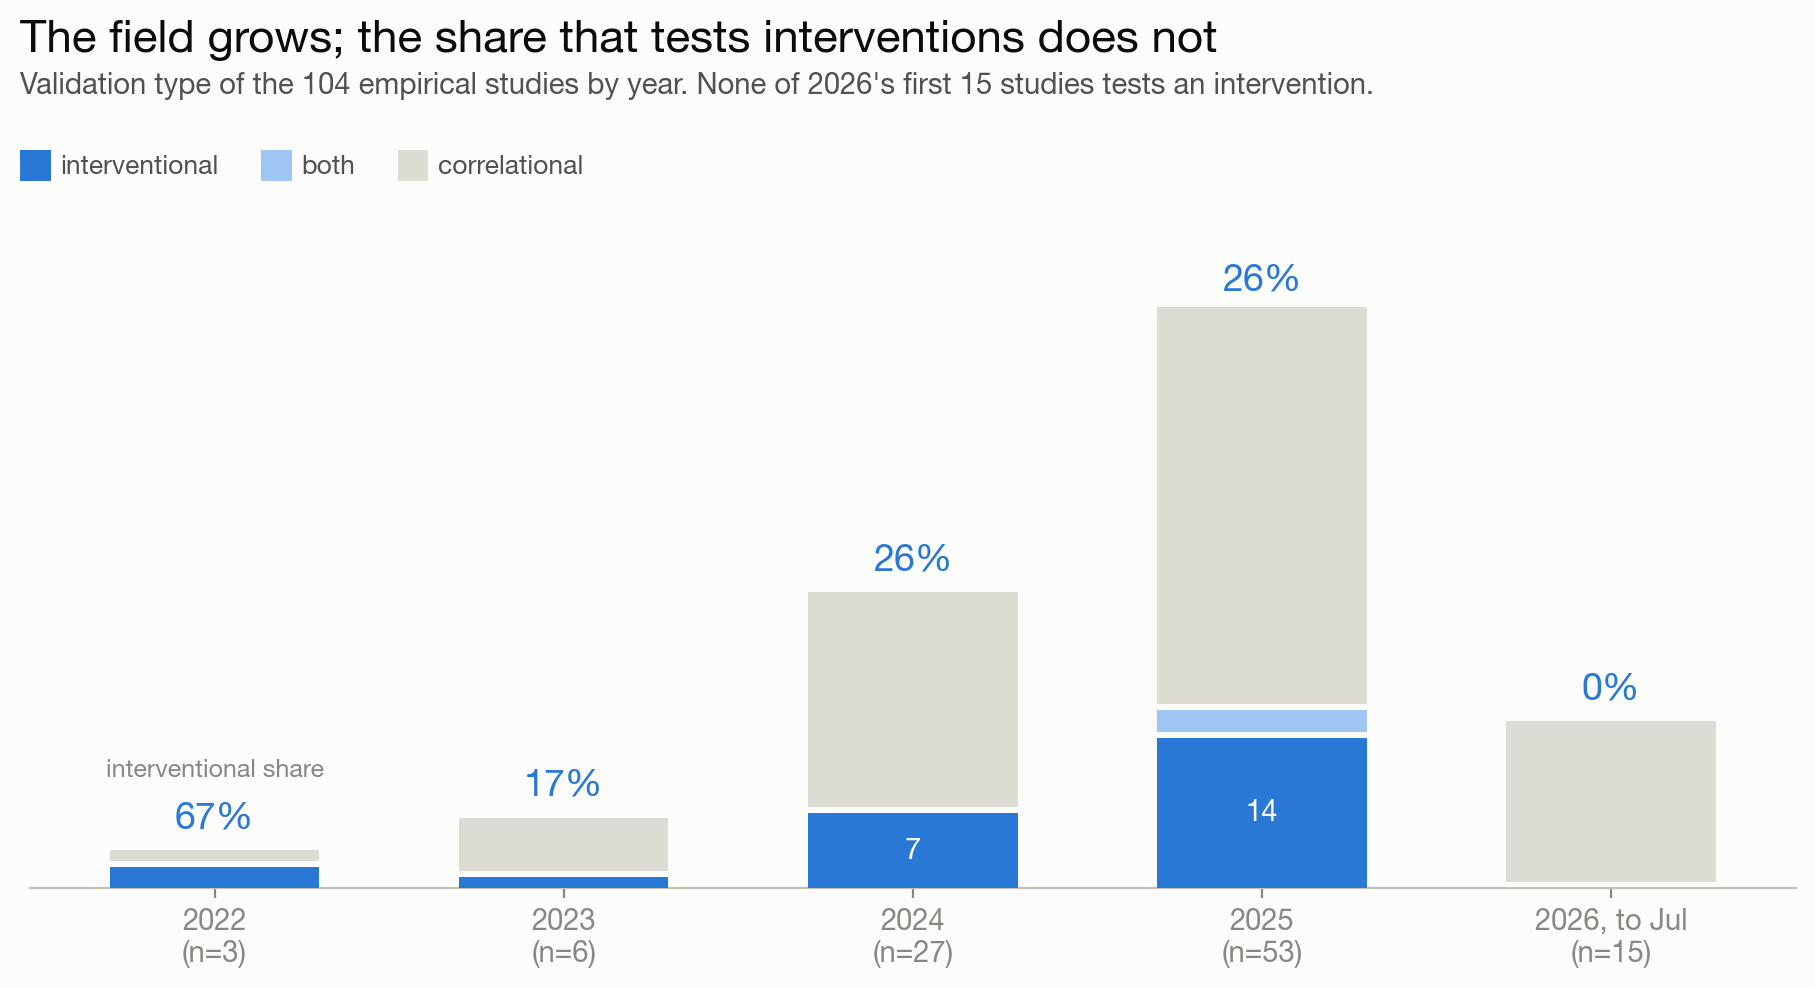
24 interventions working-paper claim Interventional share by year, from the paper's coding; per-study table not yet public.
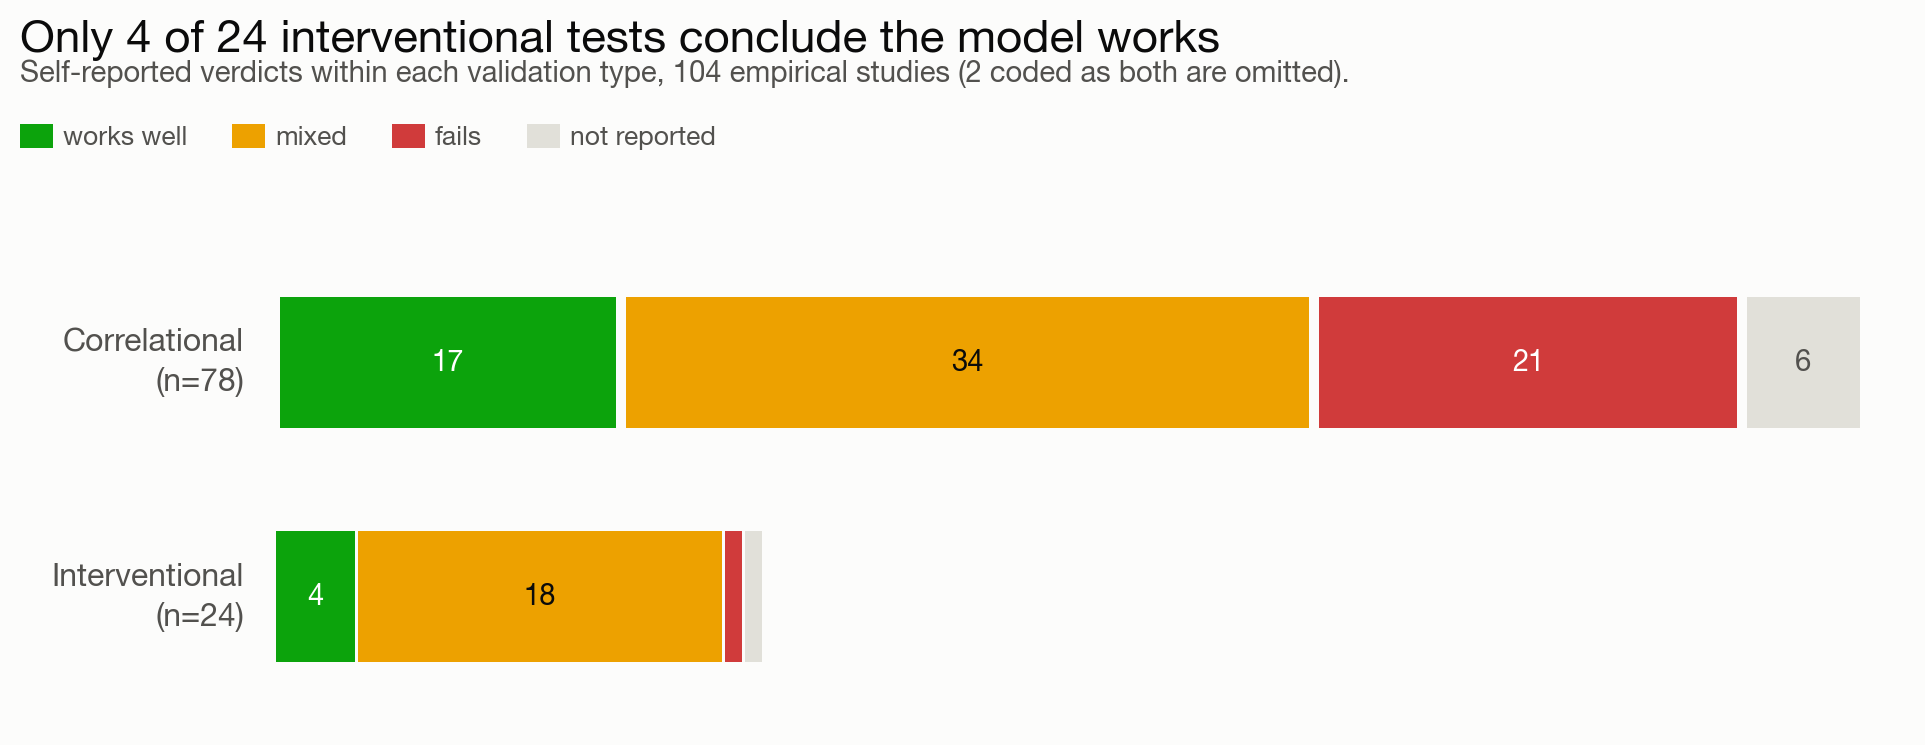
4 worked well working-paper claim Verdicts within each validation type: 4 of 24 interventional tests; per-study table not yet public.
0.55 / 0.73 rank correlation working-paper claim 0.55 across all ~300 conjoint replications, 0.73 on the 43 passing design filters; per-study replication data not yet public.
r = 0.85 pooled effect prediction external evidence Hewitt, Ashokkumar, Ghezae and Willer, Nature (in press): strongest prior result on the effect-size rung; cited, not ours.

The rows marked "working-paper claim" trace to a Subconscious working paper that has not been peer reviewed. This page makes no customer, revenue, or traction claims; those live in the private diligence packet, available on request.

Technical path

Read the method without making every executive read the appendix.

What the benchmark checks
  • What counts as human comparison.
  • What counts as intervention.
  • How confidence intervals are used.
  • Variance collapse.
  • Demographic flattening.
  • Over-rationality.
  • Prompt sensitivity.
  • Social-desirability bias.
Working-paper source bundles

Paper 1 defines the interventional-fidelity standard. The Causal Atlas defines the replication program and is explicitly a vision paper, not an empirical results report.

Both public bundles mirror Ditto revision ed69380. Ditto remains the canonical editable source.

Open Paper 1 source Open Causal Atlas source

Next action

Pick the standard before the simulation.

A flight simulator for business is credible only when it is validated against the physics of human response.

Page record

Last verified 2026-08-15. Research bundles mirror Ditto ed69380. This page is maintained under version control; every change below shipped as a reviewed pull request.